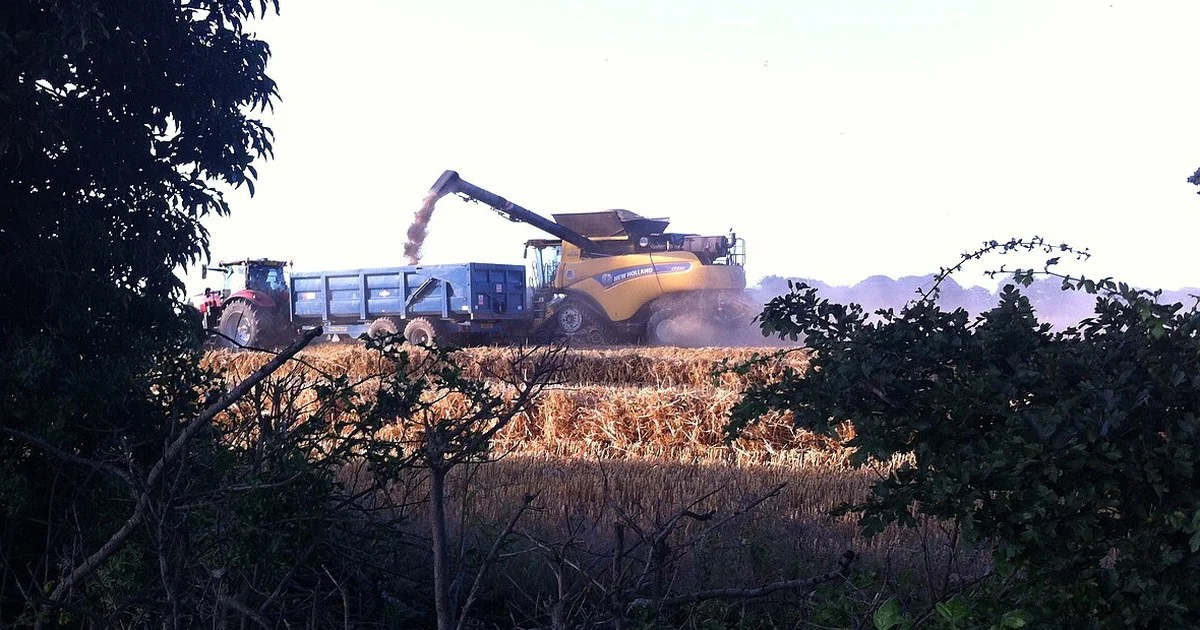
Cover photo: Unloading on the move, Astley. Photo: A J Paxton, geograph.org.uk (cropped), CC BY-SA 2.0 · Source
Tim’s take:
The early-harvest story and the bad-harvest story got told in the wrong order. Through July the line was that 2026 was the earliest harvest in twenty years, which sounded like good news and was reported as such. The yield figures landed afterwards and said something else. What complicates it is that the same dry weather that cost wheat put oilseed rape at 4.0 t/ha, the top of its ten-year range, so a bad harvest is not what happened on every farm. Wheat carried the loss. Whether 2026 finishes as the worst since 1984 or merely inside the worst five turned on spring barley, and AHDB‘s final report of 25 September has answered as far as a survey can. As the combines moved north the spring barley average came back from 29% below the five-year line in mid-August to 17%, and wheat from 13% down to 11%. That is a real improvement and a modest one. It softens the verdict without changing it: most farms in the survey still cut less wheat than their own historical average.
The one figure below I keep coming back to is the barley area: 963,000 hectares, the smallest since 2010. Set that against 30% more oilseed rape and a wheat area nudged up, and you can see the shape of the season before a combine moves. It also tells you why anyone on a malting contract should watch the early quality columns more closely than the yield ones.
Bookmark this page and come back as each AHDB report lands. Read the percentages against the five-year average, not against last week, and keep your selling plan next to the pace numbers, because that is where the two decide each other.
Harvest 2026 is the earliest in the UK since AHDB’s records began in 2006. AHDB’s final report, with data to 21 September, has wheat finished at a disappointing 6.9 t/ha, down 11% on the five-year average, oilseed rape at 4.0 t/ha, up 19%, and spring barley, the season’s casualty, 99% cut and 17% down after clawing back as the harvest moved north. This page tracked the season report by report.
A way through this story
Introduction
UK harvest 2026 is now forecast to be the smallest since detailed records began in 1984. AHDB’s final harvest report, published 25 September, puts wheat at 6.9 t/ha against a ten-year average of 7.9, with the crop fully cut. ECIU’s analysis of the previous report put the cereals and oilseeds crop at 18.5 million tonnes, around £550m short of what March forecasts implied; the slightly better yields in the last two reports should lift that figure a little, but not out of record-low territory.
This page tracks harvest 2026 as it happens: what proportion of each crop has been cut, what the early yields and quality look like, and what it means for anyone deciding whether to sell off the combine or put grain in the shed. We updated it through the season as AHDB’s official harvest progress figures landed, four reports this year rather than a weekly bulletin, with the newest week at the top; the final report was published on 25 September.
If you want the timing question, when each crop comes off and in what order, see our guide to harvest 2026 dates. The crop-by-crop numbers, wheat, barley, oilseed rape and oats against their ten-year averages, sit in our harvest 2026 yields page. And once the combines finish, the next job is already waiting: our winter wheat drilling dates and seed rate calculator covers the first decision of the new season.
The harvest 2026 scoreboard
GB harvest progress — AHDB final report to 21 September 2026
Week 11 of the season. Yields are averages for the area cut, read against the five-year average. This is the final table of 2026, from the last of the season’s four AHDB reports.
| Crop | Cut | Yield so far | vs five-year average |
|---|---|---|---|
| Winter barley | complete | 6.9 t/ha | in line |
| Oilseed rape | complete | 4.0 t/ha | up 19% |
| Wheat | complete | 6.9 t/ha | down 11% |
| Oats | complete | 4.6 t/ha | down 14% |
| Spring barley | 99% | 4.8 t/ha | down 17% |
| Beans | —* | — | — |
*The final report gives no national bean percentage: beans finished in England in the week ending 31 August, with some still to cut in Northern Ireland, and yields ranged from 14% to 140% of farms’ own five-year averages.
Source: AHDB GB harvest progress, from a survey of 60 farms run by The Andersons Centre. This is the final report of 2026.
What the shortfall costs
ECIU revised its estimate on 14 August, the day the second AHDB report landed, and the direction was down again. The new survey yields put the cereals and oilseeds crop at 18.5 million tonnes, a million below the early-August figure and 1.35 million tonnes under 2020, the previous record low. Against the March forecasts the gap is now worth around £550m, and total output is forecast at £3.64bn, roughly a third below the 2014 to 2023 average once inflation is counted. On those numbers, four of the five worst harvests since 1984 have come this decade: 2020, 2024, 2025 and now 2026.
The Energy and Climate Intelligence Unit had first put a number on it on 5 August: between £293m and £390m of lost revenue across the UK cereals and oilseeds crop. The range matters more than the headline, and most of the coverage quoted only the top of it. ECIU reached the estimate by setting AHDB’s provisional yields against the forecasts the USDA published in April and COCERAL published in March, which puts the 2026 crop near 19.5 million tonnes, about 2.5 million tonnes short of what those forecasts assumed.
ECIU’s land and food analyst Tom Lancaster said farming is now “the sector most exposed to climate change”. Martin Lines, who runs the Nature Friendly Farming Network and farms himself, called the harvest “a real kick in the teeth”.
The NFU answered on the same day, and its statement looked forward. Jamie Burrows, chair of its combinable crops board, said growers “desperately need investment to develop crop varieties that are more resilient to drought and disease”. The nearest public money for on-farm investment is less glamorous: our guide to what is left of the 2026 capital grants covers the pots still open and how to apply.
The earliest harvest in at least 20 years
It is official. AHDB confirmed on 31 July that harvest 2026 is the earliest since its records began in 2006, the product of another year of exceptionally hot and dry weather. This is the second season running that combines have started well ahead of normal, and across the South and East of England many farms finished two to three weeks ahead of the long-term average, some of them cutting at night to keep out of the worst of the daytime heat.
The dividing line this season is water. Crops on lighter soils that could not hold moisture through the dry spring have generally come off worst, while heavier land has held its yields together. That split runs straight through the first report’s figures below: wheat under its ten-year average with a farm-to-farm spread of 3.9 to 11.5 t/ha, and oilseed rape the one crop genuinely ahead of its benchmark.
AHDB’s director of cereals and oilseeds, Anthony Hopkins, described the financial pressure on the hardest-hit businesses as “increasingly acute”. With the south largely finished, the season’s verdict now rests on the August wheat cut further north, and on whether the strong milling quality reported so far holds. The final official report was published on 25 September and is read in the newest entry below.
Week ending 21 September: the final report, and wheat closes 11% down
AHDB’s fourth and final harvest report of 2026 was published on 25 September, covering cutting up to Monday 21 September, week 11 of the season. Wheat, winter barley, oilseed rape and oats are finished on the survey farms, and spring barley stands at 99%, with one Scottish business still to finish; AHDB hears of some spring barley and spring oats still standing in the north of Scotland, and some pulses in Northern Ireland. The last wheat on the survey farms was cut in the week ending 14 September. After the exceptionally early start and the rapid run through England and Wales, the pace slowed as the combines went north into wetter weather, and wheat finished broadly in line with 2025.
The north lifted the averages once more, and again not far. Wheat closes at 6.9 t/ha, 11% below the UK five-year average, up from 6.8 t/ha in the third report, and AHDB points out that the benchmark was already dragged low by the below-average 2024 and 2025 harvests. Reported wheat yields ran from 3.9 to 11.5 t/ha, but only a small share of farms got near or above their usual figure. Spring barley rose to 4.8 t/ha from 4.6 and finishes 17% down; oats reached 4.6 t/ha and 14% down. Winter barley settled at 6.9 t/ha, broadly in line with its five-year average, and oilseed rape held at 4.0 t/ha, up 19%. Beans finished in England in the week ending 31 August, with yields so scattered, from 14% to 140% of farms’ own averages, that AHDB draws no conclusion from them.
Wheat quality is the season’s consolation. Group 1 specific weights averaged 81 kg/hl within a 76 to 85 range, Hagberg falling numbers averaged 365, well clear of milling specification after the dry harvest, and protein averaged 13.5%, with samples up to 15.6%. Barley is harder to read: winter barley specific weights of 63 to 66 kg/hl, spring barley 56 to 63, and grain nitrogen on malting samples anywhere from 1.2% to 2.3%, so maltsters will keep testing load by load. Spring barley moisture averaged 14.5% as the wet weather in the north lingered. AHDB’s overall verdict is that yields were disappointing and highly variable, and that quality varies enough to make the crop harder to manage in store.
Week ending 24 August: the north lifts the averages, a little
AHDB’s third harvest report of 2026 was published on 28 August, covering cutting up to Monday 24 August, week 7 of the season. Winter barley and oilseed rape are done. Wheat stands at 94% cut and spring barley at 80%, up from 54% a fortnight earlier. What is left is northern: Scotland, Northern Ireland and pockets of northern England. Scotland got 54% of its spring barley in by 24 August, its fastest progress since 2022, which is a better run than the wet start there suggested.
Every headline yield moved the right way this fortnight, and none moved far. Wheat is averaging 6.8 t/ha, 12% below the UK five-year average, back from 13%. Spring barley is the biggest change: 4.6 t/ha against 4.1 a fortnight ago, and 19% below the five-year line rather than 29%. Oats are 4.4 t/ha, 17% down instead of 21%. Oilseed rape finished on 4.0 t/ha, 19% above its five-year average, and winter barley closed broadly in line with its. The reason is geography rather than any change of fortune in the fields already cut: the crops coming off in the north have done better than the drought-hit ground in the South and East, and they are pulling the national averages up as they land.
The report does not soften the underlying picture. “As harvest moves into its final stages, the overall picture remains one of considerable variability,” said Helen Plant, AHDB’s lead cereals and oilseeds analyst. “The differences we are seeing between farms are significant.” Anthony Hopkins, AHDB’s director of cereals and oilseeds, was blunter: “For many growers, this has been an extremely challenging harvest.” AHDB also flags quality as highly variable this year, which makes the crop harder to manage in store, so anyone holding grain should be sampling and monitoring rather than assuming a settled heap. National production estimates are being held back until the spread narrows. The final report followed on 25 September.
Week ending 10 August: England nearly finished, spring barley the new disappointment
AHDB’s second harvest report of 2026 was published on 14 August, covering cutting up to Monday 10 August, week 5 of the season. In England the job is close to done: wheat went from 54% to 85% cut in the fortnight, which AHDB says is still the fastest UK wheat harvest for more than 20 years, and oats from 32% to 80%, the fastest oat harvest in over two decades. Winter barley is finished in England and Wales and stands at 98% nationally; oilseed rape likewise at 95%. Beans reached 59% and spring barley 54%, up from 8% a fortnight earlier. The tail is all northern: wet weather has slowed Scotland and the North of England, and by 10 August Scotland had cut just 5% of its wheat, 2% of its spring barley and 59% of its rape.
The yield picture has hardened rather than improved. Wheat eased from 6.8 to 6.7 t/ha, still 13% below the UK five-year average, on a spread of 3.9 to 11.5 t/ha, and most surveyed farms remain below their own historical performance. The new disappointment is spring barley: 4.1 t/ha across the half of the crop cut so far, 29% below the UK five-year average, with reported yields from 2.2 to 7.6 t/ha. Oats slipped from 4.9 to 4.2 t/ha, 21% under the five-year line, as more spring oats came off in the South of England. On the other side, oilseed rape held 3.9 t/ha, now put at 18% above the five-year average, and winter barley closed at 6.8 t/ha, level with its recent norm. One caution from the report: Scotland has barely started on spring crops and the anecdotal word there is better than in the South, so those averages can still move.
Quality is still carrying the wheat story: specific weights averaging 82 kg/hl, Hagbergs averaging 365, and protein around 13.5% with samples up to 15.5%. The new watch item is moisture as combining moves north, with barley samples in Scotland reported as high as 17.5% for winter and 19% for spring. Straw has been as variable as the grain, brittle and dusty off the driest land, with early-season prices around £20/t below the March highs and broadly level with last summer.
Week ending 27 July: the first official report, and wheat is the sore one
AHDB’s first harvest report of 2026 was published on 31 July, covering cutting up to Monday 27 July, which the series counts as harvest week 3. The format has changed this year: four reports across the season rather than a weekly bulletin, built from a survey of 60 farms run by The Andersons Centre, with a panel of merchants covering quality. Early editions draw on fewer farms than later ones, so the figures below carry more uncertainty than the September ones will.
The pace first. Winter barley is all but finished at 95% cut, with what remains sitting mostly in Yorkshire, Scotland and Northern Ireland. Oilseed rape stood at 73%, largely done across southern England but only 8% cut in Scotland. Wheat was 54% harvested, led by the South West on 96%, and across southern England many farms expect to finish within the week if the settled weather holds. Beans were 44% cut, oats 32%, and spring barley just 8%.
Now the yields, and wheat is the disappointment: 6.8 t/ha on average so far, down 13% on the UK five-year average, a benchmark already dragged low by 2024 and 2025. Only 10% of surveyed farms beat their own five-year average. Reported yields ran from 3.9 to 11.5 t/ha, which is the dry spring writing itself into the results: strong moisture-holding land held up, light land did not. Winter barley came in at 6.8 t/ha, down 2% on the five-year line, with an even wider spread of 3.4 to 11.0. The bright spot is oilseed rape at 3.9 t/ha, up 17% on the five-year average. Oats stood at 4.9 t/ha with a third of the crop cut, and spring barley’s early 5.3 t/ha means little with 8% harvested. One footnote on baselines: AHDB benchmarks these against Defra-based UK averages (its table has 2025 wheat at 7.2 t/ha on that basis), a slightly different measure from the GB harvest-report finals in the yardstick section below.
Quality is the counterweight. Wheat specific weights have been exceptional, running 76 to 85 kg/hl with most samples discussed at 82 or better, Hagbergs are comfortably above milling specification after the dry run, and protein is averaging around 13.5% with samples above 14% not uncommon. A smaller wheat crop with a strong milling sample is exactly the year premiums earn their keep. Winter barley specific weights sit at 63 to 66 kg/hl with grain nitrogen from 1.7 to 2.0%, so maltsters will be testing load by load. Rape oil contents are running 42 to 45%, and the moisture worry never materialised: 7.3% on average.
Straw deserves a line, because volumes have been as uneven as the grain: smaller swaths in the east, heavier in the west, with brittle, dusty crops raising the fire risk and some fields combined while the straw was still green because the grain would not wait. Early prices are close to last year’s harvest levels and about £20/t below the March highs, which is the usual seasonal flush of supply rather than a signal about the winter.
Week beginning 6 July: combines rolling, no official scoreboard yet
By 12 July, AHDB’s first GB harvest progress report of 2026 had still not been published; it eventually landed on 31 July. The fields had not waited. Winter barley is being cut across Norfolk, Suffolk, Cambridgeshire and the South East, according to Hectare’s harvest report of 6 July, with winter linseed under way in Kent and the earliest wheat in the south expected around 14 to 15 July.
The starts were remarkably early. Farmers Weekly reported Elveden Farms, on the Norfolk-Suffolk border, cutting Buccaneer winter malting barley from 26 June at 9% moisture, with yields of 6 to 8.5 t/ha on irrigated land. PX Farms in Cambridgeshire started on 29 June and took 7.2 t/ha off its first field. One Suffolk family farm began on 25 June, four days ahead of its previous earliest ever. Oilseed rape cutting began near Cambridge on 28 June.
Three readings from that. First, the early yields are better than the dry spring gave anyone the right to expect, though the earliest cut ground includes irrigated land and light-land crops that raced to ripeness, so treat them as anecdote, not average. Second, moisture is exceptionally low: 9% barley means no drying bill, but every point of moisture below the contract standard is weight sold for nothing, and it is worth doing that sum before letting a dry sample sit in the field for the sake of convenience. Third, this is not just a British story; AHDB’s arable market report of 6 July had 83% of the French winter barley crop cut by 29 June against a five-year average of 39%.
On the market side, the same report put new-crop feed wheat futures (Nov-26) at £177.75 per tonne, up 25p on the week, with East Anglia delivered feed wheat for November at £178.50, down £3.00. An early, fast harvest arriving into a flat market is exactly the setup described in the selling section below: the carry decision starts now, not in September.
Week beginning 29 June: poised, not started
At the end of June the official score was nil-nil: AHDB’s GB harvest progress reports had not yet begun for 2026, and the first edition of the season did not arrive until 31 July. The first winter barley in the south and east was the crop to watch in the meantime.
What we do know is the state of the crops going in. AHDB’s crop condition report, with data to 22 June 2026, put 58% of GB winter wheat in good or excellent condition, down from 64% a month earlier after a dry April and May. Winter barley stood at 64% good or excellent, winter oilseed rape at 80%, and spring barley at 55%. England carried the worst of the moisture stress; Scotland, Wales and Northern Ireland had a kinder run.
Two things follow from that. First, expect an early and uneven start: drought-stressed crops on light eastern land ripen ahead of schedule, so the first cutting reports may look quick without saying much about the national crop. Second, the winter oilseed rape story is worth watching all season. The area is up 30% on last year and the crop has the best condition scores of anything in the ground.
The baseline: what is in the ground for 2026
AHDB’s Early Bird Survey set out the areas planted for harvest 2026:
Wheat: 1,675,000 hectares, up 1% on 2025.
Oilseed rape: 316,000 hectares, up 30% and the largest area since 2023.
Winter barley: 356,000 hectares, down 2%.
Spring barley: 610,000 hectares, down 15%.
Total barley: 963,000 hectares, the smallest barley area since 2010.
Oats: 170,000 hectares, down 14%.
The shape of the season is in those numbers before a single field is cut: more wheat and much more rape to gather, and the smallest barley harvest in sixteen years, which matters for anyone on a malting or feed contract.
The condition the crop went in with
Area is only half the baseline. The other half is the condition those crops were in on the way to the combine, and 2026 spent its spring giving some of that back.
Winter wheat rated good or excellent fell from 74% at the end of April to 64% at the end of May. Winter barley went from 70% to 62% over the same month. Winter oilseed rape held up better, easing from 84% to 78%.
The cause was no mystery to anyone who stood in a field this spring. April and May ran dry, and AHDB’s crop development report put the slide down to that dry start. Bursts of heat above 30°C added stress on top, with leaf rolling visible in wheat wherever moisture ran short, and any benefit from passing rain proving short-lived on lighter land.
Worth keeping in proportion: even after the slide, AHDB had wheat and barley conditions ahead of the previous two seasons. This was a good crop worn down by a dry spring rather than a poor one from the start, which is why the yield figures further up this page read worse than the spring ratings on their own would suggest.
The 2025 yardstick
To judge whether a 2026 yield figure is good news, you need last year’s finals. AHDB’s closing 2025 harvest report, with the season complete by late September, put average GB yields at:
Wheat: 7.6 t/ha.
Winter barley: 6.7 t/ha.
Spring barley: 5.8 t/ha.
Winter oilseed rape: 3.7 t/ha.
Oats: 5.2 t/ha.
When the first 2026 yield indications arrive, those are the lines to read them against. Early-cut fields tend to be the stressed ones, so first-week yield reports usually flatter nobody; the season average only settles once the main August wheat area is in.
What the first report of a season usually shows
The opening report of a harvest season follows a pattern, and knowing it stops you over-reading week one.
It is nearly all winter barley. In 2025, the earliest-starting season in AHDB’s records for at least 19 years, the first report showed 10% of the GB winter barley area cut by 9 July, against a five-year average of about 6% at that point, with wheat untouched. The regional spread was the real story: the Eastern region had 38% of its winter barley in, the South East 19%, and the north and west had not started.
Expect the same shape in 2026, possibly with a sharper eastern skew. The dry spring stressed crops hardest on the light land in eastern England, and stressed crops come fit first. A fast-looking week one driven by burnt-up fields on the Suffolk sands tells you about the weather in May, not the size of the national crop.
The reports that matter for the season’s verdict come from mid-August, when the wheat percentages start moving in earnest and the early yield indications carry real area behind them.
Beyond tonnes: the quality signals to watch
Yield gets the headlines, but for a lot of farms the quality columns in the weekly reports decide the year, because quality is the gap between premium and feed money.
For wheat, the two numbers that matter are protein and Hagberg falling number. Milling premiums hang on both, and Hagberg is the fragile one: it falls when ripe crops stand through warm, wet spells, which is why a broken August forecast puts milling growers on edge. Our guide to why weather forecasts are always wrong for your farm explains how to read those windows like a forecaster. For malting barley, the buyer is testing germination and grain nitrogen, and a wet harvest raises the risk of pre-germination that turns a malting sample into feed. Specific weight, reported for all the cereals, is the broad-brush indicator: a light, screenings-heavy sample after a stressed season shows up there first.
The reading rule from early weeks applies double to quality: first-cut fields are disproportionately the stressed ones, and their samples flatter nobody. A poor specific weight in mid-July from drought-hit barley says little about the milling wheat still finishing on stronger land. Quality verdicts, like yield verdicts, are August and September stories.
Selling off the combine or storing: the harvest decision
Every week of harvest progress feeds the same on-farm question: sell now, off the combine, or dry it, store it and carry it.
Harvest is the point of maximum supply, so spot prices tend to sag as the season peaks; the market knows the grain has to go somewhere, and haulage and intake queues do the rest. Carrying grain into the winter usually earns a premium over harvest movement, but it is not free money: it has to beat the cost of drying to a safe storage moisture, the interest on money not yet banked, and the risk that the market moves against you anyway.
A fast, heavy harvest tips that calculation one way, a stop-start season with quality worries tips it the other, because anything dry and in specification gets scarcer when the weather breaks. That is why the pace numbers on this page and the price columns belong together. For the mechanics of the decision, from reading ex-farm quotes against futures to what a forward contract is actually insuring, see our working guide to UK farm prices in 2026.
The price backdrop
Harvest pace and grain prices move together. A fast, heavy harvest weighs on spot prices as grain floods the market; a stop-start season with quality worries can put a premium on anything dry and in specification. The current ex-farm and futures quotes, refreshed from each AHDB weekly arable market report, are on our UK wheat prices tracker.
Going into the season, AHDB’s arable market report of 29 June 2026 had new-crop feed wheat (November 2026 futures, East Anglia) at £181.50 per tonne, up £2 on the week, with hot, dry weather across France and the US Midwest putting weather risk back into the market. Where that goes as combines roll is one of the two numbers that decide what harvest 2026 is actually worth; the other is what your own weighbridge says.
For how to read the price series themselves, deadweight cattle and lamb, feed wheat, farmgate milk, see our working guide to UK farm prices in 2026.
How to read the AHDB figures
AHDB publishes the percentage of each crop harvested, nationally and by region, for wheat, winter barley, spring barley, oats and winter oilseed rape, alongside early yield and quality indications; in 2026 that comes as four reports across the season rather than a weekly bulletin. Three habits make the numbers useful rather than noise.
Compare against the five-year average, not last week. Ten per cent of winter barley cut in the second week of July is quick; the same figure in August is a crawl.
Watch the regional split. National percentages hide the gradient: the east can be half done while the north has not started, and in a stretched season like this one the gap will be wide.
Treat early quality reports with care. The first cut fields are often the stressed ones, and specific weights and nitrogen contents from them rarely represent the crop that follows.
Update log
25 September 2026: week ending 21 September added from AHDB’s fourth and final report, published 25 September. Wheat complete at 6.9 t/ha and 11% down, spring barley 99% cut at 4.8 t/ha and 17% down, oats 4.6 t/ha and 14% down, winter barley 6.9 t/ha and in line, oilseed rape 4.0 t/ha and 19% up. Scoreboard, introduction and FAQs refreshed. This is the last AHDB harvest report of the season.
3 September 2026: week ending 24 August added from AHDB’s third report, published 28 August. Wheat 94% cut at 6.8 t/ha and now 12% down, spring barley 80% cut at 4.6 t/ha and 19% down rather than 29%, oats 17% down, oilseed rape finished at 4.0 t/ha and 19% up. Scoreboard, introduction and FAQs refreshed; one report remains, due 25 September.
19 August 2026: ECIU’s revised estimate of 14 August added: cereals and oilseeds cut to 18.5 million tonnes, around £550m down on March forecasts, which would make 2026 the smallest harvest since detailed records began in 1984. Introduction and cost section updated; AHDB survey figures unchanged.
16 August 2026: week ending 10 August added from AHDB’s second report, published 14 August. Wheat 85% cut at 6.7 t/ha, spring barley the new disappointment at 4.1 t/ha, down 29%, oilseed rape confirmed up 18%. Scoreboard and FAQs refreshed; two reports remain, due 28 August and 25 September.
4 August 2026: season headline added after AHDB confirmed the earliest harvest since its records began in 2006. Earlier weekly entries switched to past tense now the first report is out; their content stands as written.
31 July 2026: week ending 27 July added from AHDB’s first official report of the season. Wheat 54% cut at a disappointing 6.8 t/ha, winter barley all but finished, oilseed rape up 17% on the five-year average. FAQs refreshed; the series is four reports this year, not weekly.
12 July 2026: week beginning 6 July added. Combines rolling in the east from 25–26 June (earliest starts on record for some farms), first farm yields 6–8.5 t/ha winter barley at very low moisture, no official AHDB progress report yet. Market backdrop updated from AHDB’s 6 July arable market report.
4 July 2026: page created ahead of the season. Crop condition baseline (data to 22 June) and Early Bird planted areas in place, with 2025 final yields as the comparison line. First AHDB GB harvest progress report of 2026 expected around mid-July; from then on this page is updated weekly, newest week at the top, through to the last spring barley in September. If you spot the combines moving in your area before the official figures do, the reports always lag the fields by a few days.
Frequently Asked Questions
Is harvest 2026 the earliest on record in the UK?
It is the earliest since AHDB’s records began in 2006, confirmed by the levy board on 31 July after another exceptionally hot, dry season. Many farms across southern and eastern England finished cutting two to three weeks ahead of the long-term average, for the second early year running.
How much of harvest 2026 has been completed?
By 21 September 2026, AHDB’s final harvest report had wheat, winter barley, winter oilseed rape and oats complete on its survey farms, with spring barley 99% cut. What remained was a small area of spring barley and spring oats in the north of Scotland and some pulses in Northern Ireland. After its exceptionally early start, the wheat harvest finished broadly in line with 2025.
When is the first AHDB harvest report of 2026?
The first report of 2026 was published on 31 July, covering cutting up to 27 July, which AHDB counts as harvest week 3. The format has changed this season: four reports through to late September rather than a weekly bulletin, compiled for AHDB by The Andersons Centre.
Where do the weekly harvest figures come from?
From AHDB’s GB harvest progress reports. In 2026 the data comes from a survey of 60 farms across the UK run by The Andersons Centre, with a panel of merchants reporting on quality. Farmers report yields against their own five-year average, and the difference is applied to Defra’s regional averages. Earlier reports draw on fewer farms, so early figures carry more uncertainty than later ones. We read each edition as it lands and update this page with what matters.
What yields are expected for harvest 2026?
AHDB’s final report, data to 21 September, puts wheat at 6.9 t/ha, down 11% on the UK five-year average, and spring barley at 4.8 t/ha, down 17% with 99% of the crop cut. Winter barley finished broadly in line with its five-year average at 6.9 t/ha and winter oilseed rape is the bright spot at 4.0 t/ha, up 19%. Oats finished at 4.6 t/ha, down 14%.
BritFarmers Weekly
One email a week: what’s moved on schemes, prices, disease control and policy, with links to primary sources. Free. No sponsors. Unsubscribe anytime. Subscribe.
Source: AHDB
You’ve reached the end of this story.